Designation in the city. Conditional tactical signs
Topographic symbols
Conventional signs , which are used on topographic maps and plans, are mandatory for all organizations conducting topographic work.
Depending on the scale of the plan or map being created, the corresponding symbols are also used. In our country, the currently valid symbols are:
Symbols for a topographic map at a scale of 1:10000. Moscow: Nedra, 1977.
Symbols for topographic plans scales 1:5000, 1:2000, 1:1000, 1:500. Moscow: Nedra, 1973.
Symbols, font samples and abbreviations for topographic maps at scales 1:25000, 1:50000, 1:100000. M.: Nedra, 1963.
Conventional signs for ease of use, they are grouped according to homogeneous features and placed in tables consisting of a serial number, the name of a conventional sign and its image. At the end of the tables there are explanations for the application and drawing conventional signs , as well as an alphabetical index of conventional signs with their serial numbers, a list of abbreviations of explanatory inscriptions, frame design samples and font samples indicating the name of the font, its size and index according to the "Album of Cartographic Fonts".
Students of geodetic specialties are required not only to know the symbols in order to freely read topographic maps and plans, but also ability to draw them in strict accordance with the requirements of instructions and instructions. To this end, in curriculum a course of topographic drawing is provided, which is understood as the process of graphic reproduction on paper with the help of conventional signs and explanatory inscriptions of the results of various types of surveys.
Conventional signs drawn by hand and with the help of drawing tools:
straight-line contours are drawn with a drawing pen,
curvilinear contours are drawn with a curved leg,
calipers draw conventional signs of forests, gardens and shrubs.
When drawing conventional signs, one should strictly adhere to those sizes and colors that are shown in the current conventional signs. The use of any other symbols is prohibited.
Classification of conventional signs
Conventional signs serve to designate various objects and their qualitative and quantitative characteristics. The completeness of the content of the map, its visibility and clarity depend on the selection of conventional signs. Conventional signs reveal the nature of the terrain and contribute to understanding the content of topographic maps and plans. Therefore, they develop such conventional signs that resemble appearance depicted object. In addition, such requirements are imposed on conventional signs as ease of memorization, ease of drawing and cost-effectiveness of the image.
depending on the size of the depicted objects and plan or map scale conventional signs can be divided into several groups:
Scale symbols or areal are intended to depict local objects in compliance with the scale of the plan or map. They depict the largest objects: forests, meadows, arable land, lakes, rivers, etc. Using scale marks on a topographic map, you can determine not only the location of an object, but also its size. In addition, the similarity of the contours of the depicted terrain objects and their orientation are preserved on the map. Areas of figures or are painted over , or filled in with appropriate symbols.
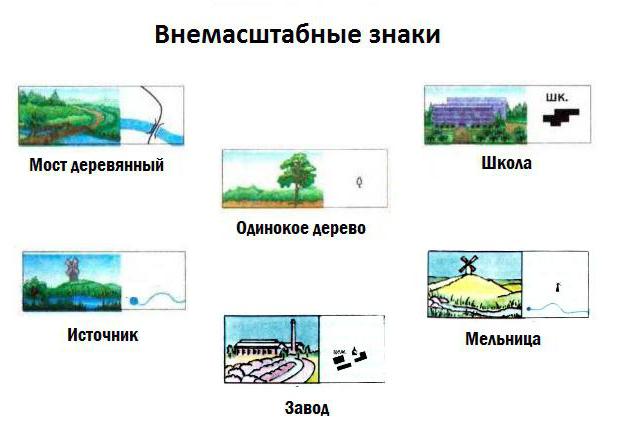
Off-scale symbols or point symbols . This group consists of objects whose areas, due to their small size, are not expressed on the scale of a plan or map. Such objects include geodetic points, kilometer posts, semaphores, road signs, stand-alone trees, etc. By off-scale conventional signs impossible judge the size of the depicted objects of the area. However, in each of these signs there is a certain point that corresponds to the position of objects on the ground. So, for example, for some conventional signs this point is located in the center of the sign (triangulation point, wells, fuel depots), for other signs it is in the middle of the base of the sign (windmills, monuments) or at the top of the right angle at the base of the sign (kilometer poles, road signs).
Out-of-scale conventional signs for depicting relief elements are used in cases where not all relief elements can be expressed by horizontal lines - curved lines connecting points of the terrain with the same marks. For example, mounds, pits, stones, waste heaps are depicted by conditional off-scale signs with the use of explanatory conventional signs in some cases.
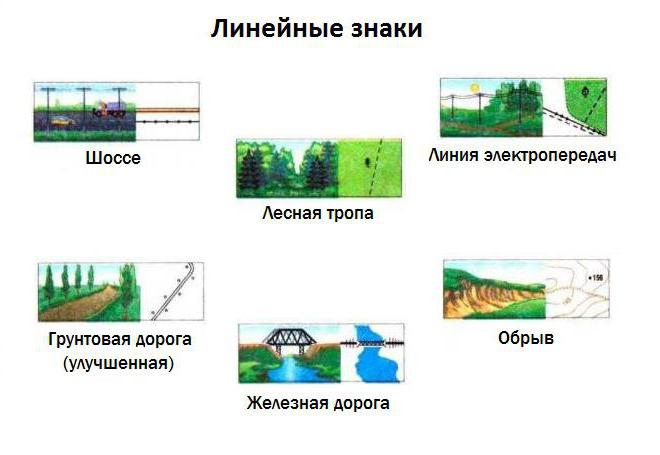
Linear symbols depict objects of the terrain that have a significant length and a small width. Such objects are roads, railways, pipelines, communication lines and power lines. The length of such features is usually expressed at the scale of the map, and their width on the map is shown out of scale. The position of the linear symbol on the map corresponds to longitudinal axis of symbol.
Explanatory symbols are intended for additional characteristics of the terrain objects depicted on the map. For example, the width and nature of the road surface, the number of households in settlements, the average height and thickness of trees in the forest, etc.
The same object on plans of different scales will be depicted differently: on plans of large scales it will be expressed by a similar figure, and on plans of small scales it can be indicated by an off-scale symbol.
MUNICIPAL BUDGET INSTITUTION OF ADDITIONAL EDUCATION
"CENTER FOR CHILDREN AND YOUTH TOURISM
AND EXCURSIONS, BRYANSK
SUMMARY OF THE LESSON ON THE TOPIC:
DEVELOPED: d/o teacher
Stasishina N.V.
Bryansk - 2014
Plan - abstract
topic classes
« Conventional signs topographic maps.
Purpose of the lesson: Give an idea of the conventional signs of topographic maps.
Lesson objectives:
To acquaint those involved with the concept of conventional signs and its varieties;
To involve members of the circle in systematic sports;
Develop the skills of teamwork and joint search for solutions;
Continue to promote development logical thinking, memory and
student attention;
Equipment: 1. posters with symbols.
2. cards with test tasks.
Class type: Learning new material.
Literature: 1. Aleshin V.M. "Tourist topography" - Profizdat, 1987
2. Aleshin V.M., Serebrenikov A.V., "Tourist topography" - Profizdat, 1985
3. Vlasov A, Ngorny A. - "Tourism" (educational manual), M., Higher
school, 1977
4. Voronov A. - "Tourist's Guide to Topography" - Krasnodar., Kn.izd-vo, 1973
6. Kuprin A., "Topography for everyone" - M., Nedra, 1976
Lesson plan
Preparatory part. (3)
Explanation of the new topic: (45)
Presentation of new information.
3. Consolidation of the studied material. (eight)
4. Summing up the lesson. (2)
5. Organizational moment. (2)
Course progress.
1. Preparatory part:
Students sit at their desks, prepare writing materials
The teacher announces the topic, goals and objectives of the lesson, explains the requirements and plan of the lesson, checks those present.
Note
for readiness for
occupation, form
clothes of those involved.
2. Explanation of the new topic:
Statement of new information:
Today in class we will look at new topic:
"Conventional signs of topographic maps".
The map has many names printed in plain words, numbers, lines, and many icons of different colors, sizes, and shapes. it topographic symbols, which indicate local objects on the map.
What are conventional signs?
Conventional signs are symbols with which the actual area is depicted on the map.
Topographers came up with special conventional signs so that they would, if possible, be similar to the local objects themselves, and correspond in size to them on a map scale. So, for example, a forest on topographic maps is depicted in green (after all, it is actually green); houses and other buildings are depicted as rectangles, because when viewed from above, they are almost always in the form of rectangles; rivers, streams, lakes are depicted in blue, since the water, reflecting the sky, also seems blue to us. But it is not always possible to depict every local object on the map accurately in shape, color and size. Take, for example, a highway with a width of 20 m. On a map of 100,000 (1 mm 100 m), such a road would have to be drawn with a line one-fifth of a millimeter thick, and on a map at a scale of 1: 200,000 this line would have to be drawn more thinner - 0.1 mm. Small in size, but important local objects are depicted on topographic maps special out-of-scale signs, that is, such signs that do not correspond to the actual dimensions local items, reduced according to the scale of a particular map. For example, a small spring on the river bank is depicted on the map as a blue circle with a diameter of a whole millimeter; in addition, highways and other major roads are colored on maps so that, as they say, they are striking to everyone who picks up a topographic map. For example, an asphalt highway is shown as a bright red line on a map.
Conventional signs used in compiling sports maps for orienteering competitions are somewhat different from topographic ones. Their main purpose is to give the athlete the information about the terrain that he needs when choosing the path of movement. These are signs showing the passability of forests, swamps, paths, etc. So, for ease of reading on the run on sports map, unlike topographic, it is not the forest that is painted over, but open space - fields, meadows, glades in the forest. All topographic symbols can be divided into four types:
1) linear- these are roads, communication lines, power lines, streams, rivers, etc. That is, these are signs of such local objects, which themselves have the form of long lines;
Write the topic on the board.
Students write down a new topic in their notebook.
2) curly- these are signs of towers, bridges, churches, ferries, power plants, individual buildings, etc.;
3) areal - these are signs of forests, swamps, settlements, arable lands, meadows - that is, local objects that occupy significant areas of the earth's surface. The signs are made up of two
elements: a contour and a sign that fills the contour;
4) explanatory- these are signs of the characteristics of the forest, the names of settlements, railway stations, rivers, lakes, mountains, etc.,
these are the width of the highway, the length, width and carrying capacity of bridges, the depth of fords on rivers, and the like.
Almost all linear and figured signs are off-scale, and area signs, as a rule, exactly correspond to the true sizes of local objects. Signs are easier to learn and remember, getting acquainted with them in groups that are formed according to the type of local objects:
group No. 1 - roads and road structures;
group No. 2 - settlements, buildings;
group number 3 - hydro network (that is, water on the ground);
group No. 4 - vegetation;
group No. 5 - relief;
group No. 6 - explanatory and special tourist signs.
Group No. 1. Roads and road structures
This group includes eleven major topographical signs.
All roads can be divided into three main types: railways for train traffic, highways and dirt roads.
Highway are called roads that have a solid artificialcoating - stone (cobblestone, paving stones), asphalt or concrete. The highway sign is off-scale. Every shos signseine road on the map is given an additional sign- letter- digital characteristic, consisting of three elements: numbers, one more number in brackets and a letter. The first digit indicates the width of the highway pavement in meters (i.e. asphalted, concretedof the roadbed or paved with stone), and in parenthesesa figure is given indicating the width of the entire highway in meters, i.e. along with the edges. The letter indicates the material with which the highway is covered: if it is asphalt, then the letter “A” is put, if concrete - the letter “B”, and if the highway is covered with buskier or paving stones (i.e. stone), then the letter "K".
The next type of roads - ground, earth roads without artificial surfacing. All dirt roads are divided into three types: simple dirt roads (they are also called field or forest roads), country roads, and so on.
called improved dirt roads (abbreviated as UGD). An improved dirt road is also an earthen road, but with a slightly convex shape for better water flow, ditches along the shoulders and gravel or crushed stone filling, compacted by a roller.
No one specially paves the paths, they arise themselves withfight from the constant walking of people. In densely populated areasrarely can a whole network go in the same direction at oncepaths that then close, then again diverge. Such a lotit is impossible to depict the nature of the paths on the map, so the grouptrails are shown as one conditional trail in the corresponding directionleniya. Only long enough in length and permanently existing (sometimes called "secular") paths are appliedon large scale maps. The symbol of the trail is almost like thisthe same as a simple dirt road - thin black intermittentdashed line, but every strokehas a shorter length.
Railways earlier from flaunted with two thin blackparallel lines, clearance between which was filled inalternating black and white shanecks. now signis a continuousthick black line. two koshort strokes across the same signrailroad means that ithas two tracks. If there is only one track then one stroke is put. If the cross stroke has anothershort stroke parallel to the railway sign, then this is known chit that the road is electrified.
At the sign of the railway station, a black rectangle inside a white rectangle is placed on the side of the railway where the station building (station building) is located.
Bridges.
On simple dirt roads, as a rule, they build wooden bridges; on highways, improved dirt roads and on important country roads, bridges are most often made of concrete (stone). On railways, large bridges over large rivers are always metal, and over small rivers - concrete. Topographic signs of bridges are figured and off-scale signs.
Where the bridge sign is placed on the map, the road and river signs are torn apart (Fig. 37). An alphanumeric description of the bridge serves as an explanatory sign for bridges. For example: DZ =
(24 - 5)/10. Here the letter "D" denotes the material from which the bridge is built - wood (if the bridge is concrete, the letter
"TO"). The coefficient 3 is the height of the bridge above the surface of the water in the river. In the numerator of the fraction, the first digit, 24, is the length of the bridge in meters, the second digit, 5, is its width in meters. In the denominator, the number 10 shows the load capacity of the bridge in tons, that is, what is the maximum weight of the machine the bridge is calculated with its design.
Bridges are often made on hiking trails, but very small ones - only for pedestrians. Such bridges (the inhabitants often call them either treasures or lavas) are sometimes just two logs laid over the river from bank to bank. The topographic sign of the footbridge is very simple.
Very often the roads are crossed by small dry
ravines, hollows, through which streams flow only in spring, when the snow melts. During the construction of the road, an embankment is made across the ravine, under which a concrete pipe is laid for
Students write in their notebooks.
Conventional signs sketch themselves in a notebook
highway

Simple dirt road

Country road

Improved dirt road

Railway

Bridge

Pedestrian bridge
water runoff. Such pipes have their own topographical sign.
Group #2. Settlements, individual buildings
There are fifteen most important topographical signs in this group. The settlements themselves - villages, auls, farms, towns, cities - are complex formations consisting of various buildings and structures. Therefore, there is no simple topographic sign of a settlement - it is made up of topographic signs of various local objects that make up what is called a settlement.
Separate residential and non-residential buildings are represented by an off-scale black rectangle. If the building is very large in area, and the map is large-scale, then the building is depicted as a black figure, similar in shape and size (on the scale of the map) to the building itself. That is, this is a large-scale sign. Often, at some distance from a village or settlement, there is a residential building with its own garden, orchard, and outbuildings.
For such a separate yard, or farm, there is a special topographical sign.
In settlements, quarters are distinguished with a predominance of wooden (not fire-resistant) and stone (fire-resistant) buildings. topographic sign quarters of the village limited to thin black lines. Inside it is given a background of either yellow (if the block is dominated by wooden buildings) or orange (if the block is dominated by stone fire-resistant buildings). On the background there are black rectangles - off-scale signs of individual houses, buildings or large-scale signs of individual large buildings. Next to the signs of some buildings, their characteristics are given. For example: "SHK." - school, "SICK." - hospital, "EL-ST." - power plant, "SAN" - a sanatorium.
The topographical sign of the fence (fencing) is the thinnest black line on the map. Such a sign is often found on maps in the form of a broken closed line, which indicates some kind of fenced area.
If an industrial enterprise is depicted on a small-scale map, then it is necessary to use an off-scale sign of a plant (factory) with a pipe (meaning a high pipe that can serve as a guide visible at a sufficiently large distance) or without a pipe. An abbreviated explanatory sign is given next to the sign, characterizing the type of products manufactured by the enterprise. For example: "kirp" - a brick factory, "muk." - flour mill, "boom." - paper mill, "sakh." - sugar refinery, etc.
If an industrial enterprise occupies a large area, then ordinary large-scale signs are used that show all or almost all the buildings and structures on its territory: a fence, a plant management building, workshops, warehouses, etc., while half-blackened
diagonally off-scale sign of the plant.

pipe under the road

Separate buildings
Farm

urban development


Plants and factories
Within the city there may bechurch, monument or a monument cemetery . A cemetery can be small or large, with or without trees. PoeTherefore, for the image of the cemetery, both large-scale andand off-scale sign. In hiking and travel you can meeteven in the deep forest a separate yard where he lives
forester and his family. Forester's house has its own topographical sign - the usual non-scale sign of a separate building with the inscription "forest."
Important landmarks can serve as well-visible from afar various ba buildingsrack type- water towers, fire towers, silos. They are marked with one off-scale sign, next to which an explanation is often given what kind of tower it is.
Good landmarks are also high wooden towers, most often standing on the tops of hills, with an observation platform at the very top, where the stairs lead. These are the so-called triangulation points(they are called trigopunks for short). Next to the trigopoint sign on the map there is always some number that indicates the height of the base of the tower above the level of the Baltic Sea in meters and centimeters.
A sign resembling bricks stacked on top of each other - peat extraction, that is, the place where peat is mined.
And the last of this group are very important local items, topographical signs which you need to know are communication lines and power lines (TL).
Communication lines are indicated on all cards, regardless of the nature of the connection, by a thin black line with black dots on it. The sign of the communication line is drawn on the map in the same way as the communication line itself goes on the ground.
Power lines(power lines) are on wooden poles or on metal and concrete supports. The power line sign consists of a thin black line, on which dots or dashes with arrows are located at intervals of one centimeter.
If the power line is laid on wooden poles, then dots are placed, if on metal or concrete supports - short thickened dashes.
Group #3. Hydrography
There are 8 basic signs in this group that you need to know.
In hiking trips, tourists constantly “communicate” with the surface waters of the earth - they set up camp on the banks of rivers and lakes, lay routes along rivers, ford them, overcome swamps, ditches, use springs to cook food on a fire.
One of the main topographical signs of this group is river sign- can be both large-scale and non-scale (along the width of the river). The sign of a wide, large river consists of two elements - the outline of the coastlines of the river (as well as the coastline of the islands, if any), which is drawn with a thin blue line, and the filling sign - a blue background depicting the surface of the river, that is, the space occupied by water.
Church
monument
forester's house
tower
trigopoint

peat mining
![]()
Communication line

power lines

big river
Off-scale sign small river or stream is a simple thin blue line, which, however, gradually thickens from the source to the mouth.
There are streams that “live” only in spring and early summer, and then the water disappears in them. it transfersflowing streams and rivers. The sign of such streams and rivers is a thin blue, but not a solid, but a dashed line.
Information about where the river flows and what is the speed of the flow will also be given by a topographic map with an explanatory sign of hydrography - a black arrow showing the direction of the river flow, and numbers placed in the middle of the arrow and showing the speed of the flow in meters per second.
Sea, lake, pond are depicted in the same way: the contours of the shores are shown with a thin blue line, and the water mirror is shown with a blue background.
In densely populated areas, wells located in settlements are shown only on very large-scale maps (on site plans). Sign well- a blue circle with a blue dot in the center.
Water sources(springs, springs) are also shown on topographic maps only when they do not dry out and are significant in terms of the amount of water. The sign of the source (spring) is a blue circle. If a constant stream flows from a spring, then it is shown with the corresponding sign. If the water soon sinks into the ground again, the sign of the stream is not shown.
swamps There are two types: passable and difficult (or even completely impassable), through which it is dangerous to move and it is better to bypass. Accordingly, there are two signs of swamps: short blue horizontal strokes grouped in the form of irregular rhombuses - this is a passable swamp, but solid horizontal blue strokes - an impassable swamp. The borders of the marshes are outlined with a black dotted line.
And the last sign of this group is the ditches, the signs of which are thin blue lines. This sign is similar to the sign of an ordinary stream, but differs sharply from it in form: the line of the stream is always smoothly winding, and near the ditches the lines are broken with long, even sections without bends.
Group number 4. Vegetation
This group includes 15 topographic signs, most of which are area and, therefore, scale signs.
The first sign is land boundaries, that is, areas occupied by one or another natural or artificial vegetation. Every forest has an edge, a field, meadow, swamp has an edge. These are their borders, which are shown on topographic maps as a small dotted black line. But the boundaries of the land are not always shown with a dashed line: if there is a road right along the edge of the forest or along the edge of the arable land, meadows, then the sign of this road replaces the sign of the boundaries, that is, the road itself already delimits the forest from the field, the field from the meadow, the meadow from the swamp, etc. d. If the garden or cemetery is surrounded by a fence, then the fence is the boundary.
When held land boundaries dotted line (or some other sign) - that is, their contours are given, on both sides of the border a filling sign is given - the background and other icons that show what exactly the contour is occupied with, what kind of vegetation is in it.
Sign the woods- green background. If the forest is old (as they say - ripe), then the background is made dark green, and if the forest is young (forest growth) - lightlo green. Also shown areparks
in populated areas.
It is important to know not only that this is a forest, but also what it is - what kind of things are in it.species of trees grow, how densely they grow.
There are special explanatory signs for this.
-
characteristics
stand. These signs areare images of small trees,signatures and numbers next to them. If in this forest(or parts of the forest) dominated by conifers,small Christmas trees are drawn on a green background, and if deciduous species predominate - small birch trees, in which the right sideon the crown is blackened. If the forest is mixed, both a Christmas tree andbirch. Abbreviated signature on the leftsigns indicate which breeds of needlesnyh and deciduous trees predominate here.
The fraction to the right of these icons means the following: the numerator of the fraction is the average height of trees in this forest in meters, the denominator is the average thickness of trunks at the level of a person’s head in meters, and the coefficient behind the fraction is the average distance between trees (that is, density the woods).
Found in the forests glades- long forest corridors. Such clearings are cut (cut) on purpose and so that the forest is better ventilated and illuminated by the sun. Most often, clearings are made mutually perpendicular: some go from north to south, others cross them from west to east. Clearings come in different widths: from 2-3 to 10-12 m, and sometimes there are very wide ones - up to 50 meters or more. Such large clearings are made for laying gas pipelines, oil pipelines, highways and railways, high-voltage power lines through forests.
Clearings divide the forest into quarters, and each forest quarter has its own number. At the intersections of the clearings there are block posts, on the edges of which these numbers are written with paint. Not every clearing has a road, there are very heavily overgrown clearings, along which it is even more difficult to make your way than straight through the forest. But the topographic sign of the clearing exactly corresponds to the sign of a simple dirt road - a thin black dashed line. A number is also placed here showing its width in meters.
For young growth forests, in addition to the light green background, an additional filling character is applied: small black circles go in rows along the background, but their rows are located at 45 ° to the map frames .
orchards are also depicted on a green background with rows of small black circles, but here their rows go at 90 ° to the map frames.
forest clearing shown on a white background. The sign that fills the contour of the cutting is staggered black vertical strokes with a short black horizontal stroke at the lower end.
Sign woodlands also, as a rule, is located on a white background in the form of black circles with a tail at the bottom, which is always directed to the east.
Large-scale topographic maps show individual groupsshrubs in the form of a black circle with three thickened black dots along the outer edge. This is an off-scale sign. If shrubs occupy large areas of the territory on the ground, they are already shown by a contour (dashed line), which is filled inside with a light green background, and circles with three points are scattered around the background in random order.
Narrow lanes of forest are depicted on cards without a green background as a chain of black circles. This is an off-scale sign of the forest belt. If the strip of forest is wide enough for a given map scale, then it is depicted as a regular forest symbol. There are also narrow strips of shrubs (hedges). They are depicted by an off-scale sign - a chain of small black circles alternating with thickened dots.
Along the roads, there are often specially planted trees, forming, as it were, a green corridor along the road (alley). These are casings, which are shown on the maps as small black circles on the sides of the road.
free standing trees(not in the forest, but in the field), if they are large and have the value of landmarks (that is, they are clearly visible from all sides at a sufficiently large distance), they are also indicated on topographic maps with their off-scale sign .
meadows have their own sign: small black quotation marks are placed in a checkerboard pattern inside the contour that bounds the meadow. Meadows can occupy very large spaces, they can stretch in narrow ribbons in the floodplain of rivers. Small clearings in the forest are also meadows. The sign of a passable swamp is almost always combined with the sign of a meadow, because such a swamp is always covered with grass.
Along the edges of the villages are gardens. The garden sign has undergone a major change in the recent past: the old sign was an oblique hatching with solid and dashed black lines, going in one direction or the other. New vegetable garden sign - gray background.
The last sign of this group, the sign arable land,
This is a white background with a black dotted outline.
Group number 5. Relief
The surface of our planet is very rarely flat. On any plain there are always at least slight elevations and depressions: hills , mounds, depressions, ravines, pits, cliffs along river banks. All this taken together represents the topography of the area. Relief is a set of irregularities in the earth's surface. All irregularities can be easily divided into two types - convexity and concavity. Convexity is considered to be positive forms, and concavities - negative forms of relief. Positive landforms include: a mountain, a hill (mound), a ridge, a hill, a mound, a dune, a sandy movable hill); to negative ones - a hollow, a lowland, a valley, a gorge, a ravine, a beam, a ravine, a pit. Forms: reliefs always alternate in space: any positive form smoothly or abruptly turns into a negative one, and a negative one sharply or smoothly turns into an adjacent positive one.
It is customary to divide flat terrain by the nature of the relief into three type:weakly crossed, medium crossed and strongly crossed terrain. The degree of ruggedness depends both on the frequency of alternation of convexities and concavities (ascents and descents), and on their height and steepness: where the relief is more "indented", that is, where ravines, hills, hollows, gullies are more common, and where they are especially high (deep) and their slopes are steeper, the terrain is considered to be very rugged.
Each landform has three parts (elements): the top or gold (for positive forms), the bottom (for negative ones), the sole (for positive ones), the edge or edge (for negative ones) and the slopes or walls for both.
slopes- a common element of both negative and positive landforms. They are steep, steep (sharp) and gentle (smooth). Depending on the prevailing slopes near the uplands and lowlands in a given area, we say: here is a soft and smooth relief or - here is a sharp, hard relief.
There are two main ways to convey relief forms on maps: smooth, soft forms are depicted by the so-called horizontal lines - thin brown lines, and sharp, hard forms - by a special line with denticles. These teeth, like any triangles, have a base and vertices. Where the tops of the teeth are directed, the slope descends there - it goes down an almost sheer cliff. To make it easy to distinguish a steep slope of natural origin from artificial cliffs on the map, jagged cliff lines are made in two colors - brown (natural cliffs along river valleys, ravines, etc.) and black (artificial embankments, dams, quarry slopes, etc. .). Next to the signs of cliffs is a figure showing the length of the cliff in meters.
Pits and mounds may be naturalmi and artificial. They can bevery deep (high), but small in area, and then they have todepict on maps off-scalesigns. If they have a significantdimensions by area, then showing them yut scale signs (Fig. 74). The number next to the sign of the mound and pit also indicates their depth and height.
Embankments and excavations along the road are also depicted on the maps with a jagged line, but already in black, since they are artificial structures. Where the teeth are directed with their sharp ends away from the railroad or highway bed, the road goes along the embankment, and where they are directed vice versa, towards the roadbed, along the recess. The numbers indicate the highest height of these slopes.
At the sign career, as a rule, the maps give an abbreviated signature, specifying what exactly is being mined in this quarry.
More complex rigid landforms are ravines, which are formed in loose sedimentary rocks under the action of soil erosion by rainwater flows and during snowmelt. Ravines are a “living” phenomenon, they are born, grow and gradually die. While the ravine is "young" (it is called ravine), its slopes are very steep, but gradually they crumble - they flatten out, overgrow with turf, bushes, the ravine stops growing and turns into beam (liewell, hollow). A ravine has a top, bottom and mouth. From one ravine to sides can depart lateral ravines with their tops - their called screwdrivers ravine. But screwdrivers, in turn, canmultiply, forming an intricate branching.
small river

 Drying river

Sea, lake
well
spring, key


glades
Orchard

 felling
 light forest

shrubs

casing

meadows


Rigid landforms


Pits and mounds

Embankments and excavations

Career
Two typical representatives of soft landforms - antipodes Hill(hill) and basin(depression). You cannot show them on the map with a jagged line, since their slopes are gentle, smooth.
If you “cut” horizontally, cut the shape of the hill into even “slices”, then the entire slope of the hill will be surrounded by several closed lines of “cuts” - horizontals. And if you then draw these lines on paper, you get a figure that gives an idea of the relief (Fig. 78). You just need to show with short strokes on the horizontal lines in which direction the slopes go down, since exactly the same figure will turn out if you cut through the basin with horizontal planes. Such strokes, showing the direction down from the horizontal, are called bergstrokes or slope indicators (in German, "berg" is a mountain).
This method of depicting soft landforms on maps and oncalled - the method of horizontals. Behind the beginning of the secant relief horizonplanes, the plane of the Baltic Sea level is taken.The next cutting plane is drawn, for example, 10 m higherlevel of the Baltic Sea, after it another 10 m in height - the second cutting plane, then, 10 m above it, - the third (already at a height30 m above sea level), etc. This distance (h) between the planes cutting the relief is called the height of the relief section and can be different: 2.5 m, 5 m, 10 m, 20 m, etc.
Each cutting plane will give on the map its own closed line of relief section - a horizontal line, and all together they will give a complete picture of contour lines - a general picture of the terrain. But since there will be a lot of contour lines on the map, in order not to get confused in them, to make it easier to distinguish and trace them, we decided to highlight some of the contour lines a little - make every fifth one thicker. Then the contours on the map, as they say, are better read. Thus, with a section height of, for example, 5 m, the thickened horizontal will be a horizontal located 25 m above the level of the Baltic Sea; the next thickened one is 50 m above sea level, etc.
In addition, on some horizontal convenient places numbers are put in brown, which indicate the height of this horizontal in meters above sea level, or, as it is customary to call this value in topography, the elevation of the horizontal. The very figure of the mark of one or another horizontal, in addition to the berghash, helps to understand in which direction the slope goes down: where this number has a bottom, the slope goes down, and where it goes up, there goes an ascent. Marks, in addition, are placed on the tops of mountains and hills. The side of the hill, which is steeper, on the map will be depicted as contour lines located close to each other, and the other, gentle side of the hill, on the contrary, will be depicted as sparse contour lines.
There is always a depression between the tops of two neighboring hills having a common sole. Such a depression is called a saddle. And under the saddle
on the slopes of hills, gullies and ravines most often appear - rigid landforms are always difficult to combine with
soft.

Group No. 6. Special characters
Signatures of names on maps are tried to be placed so that they do not cover important objects, and at the same time, one still has to make, for example, a gap in the signs of the road network where the signature of a settlement or the name of some other is superimposed on a road sign. local subject.
Signatures of the names of settlements are always made horizontal (west - east direction) in different fonts - in some places the letters of the inscription are fatter and taller, in others they are thinner and have a slight slope. Through such a difference in fonts, certain information is communicated to the card reader: an approximate
the number of inhabitants in locality. Where there are more inhabitants, there is a larger signature. Under each name of the settlement there are numbers that indicate the number of buildings (courtyards) in this village or town. There are letters next to these numbers.
"SS", denoting that in this locality there is a village council, that is, a local authority.
On their self-made maps and diagrams, tourists often enter special symbols showing the route traveled by the tourist group and its direction, crossing routes, places for overnight stays and days, places for daytime lunch breaks, places of interest along the route.
3. Consolidation of the studied material.
1. What are conventional signs?
2. How many groups can topographic symbols be divided into?
3. List these groups?
4. List what is linear?
5. List what applies to areal views?
6. How many groups are topographical signs divided into?
4. Summing up the lesson.
The teacher draws conclusions, evaluates the activities of those involved, gives an orientation for the next lesson.
5. Organizational moment.
The teacher tells the future plans for the coming week.
Definition 1
Cartographic symbols- symbolic graphic designations that are used to depict various objects and their characteristics on cartographic images (maps and topographic maps).
Sometimes symbols are called map legend.
Types of conventional signs by scale
Depending on the scale, $3$ groups of conventional signs are distinguished:
- scale (areal and linear);
- off-scale (point);
- explanatory.
With the help of areal scale signs, extended objects are displayed on a map scale. Scale signs on the map allow you to determine not only the location of the object, but also its size and shape.
Example 1
Scale marks are the territory of the state on a $1:10,000,000 scale map or a reservoir on a $1:10,000 scale map.
Linear conventional signs are used to display objects that are significantly extended in one dimension, for example, roads. Consistent with the scale on such signs, only one dimension (in which the object is the most extended), while the other is off-scale. The position of an object is determined by a conditional or explicit center line.
Out-of-scale point symbols are used on maps to represent objects whose dimensions are not expressed on the map. The largest cities on the world map are displayed as off-scale signs - dots. The actual placement of the object is determined by the main point of the point symbol.
The main point is placed at off-scale signs as follows:
- in the center of the figure near symmetrical signs;
- in the middle of the base for signs with a wide base;
- at the top of the right angle, which is the base, if the sign has such an angle;
- in the center of the lower figure, if the sign is a combination of several figures.
Explanatory signs are intended to characterize local objects and their varieties. Explanatory signs may indicate the number of railroad tracks, the direction of the river.
Remark 1
On large-scale maps, the signs of individual objects are indicated separately, on smaller-scale maps, objects of the same type are grouped and applied with one sign.
Conventional signs by content
- signs and signatures of settlements;
- signs of individual local objects;
- signs of individual relief elements;
- transport infrastructure signs;
- signs of hydrographic network objects;
- signs of soil and vegetation cover;
Signs and signatures of settlements
On maps at a scale of $1:100,000 and larger, all settlements are indicated along with the signature of their names. Moreover, the names of cities are applied in direct capital letters, rural settlements - lower case, urban and suburban settlements - in lowercase oblique letters.
Large-scale maps display the exterior outline and layout, highlighting major highways, businesses, prominent knowledge and landmarks.
Example 2
On the $1:25 \ 000$ and $1:50 \ 000$ scale maps, the type (fireproof or non-fireproof) of the development is displayed in color.
The figure below shows signs of settlements used on maps of various eras.
Signs of individual local objects
Separate local objects, which are landmarks, are drawn on the map mainly with off-scale signs. It can be towers, mines, adits, churches, radio masts, remnant rocks.
Signs of individual relief elements
Relief elements are marked on the map with appropriate signs.
Remark 2
An object of natural origin is represented by lines and signs in brown.
Transport infrastructure signs
The objects of transport infrastructure displayed on topographic maps include the road and railway network, structures and bridges.
When plotted on a map, paved roads (motorways, improved highways, improved dirt roads) and unpaved roads are distinguished. All paved roads are plotted on the map, indicating the width and material of the pavement.
The color of the road on the map indicates its type. Highways and highways are applied in orange, improved dirt roads in yellow (occasionally orange), unpaved country roads, field, forest and seasonal roads without color.
Signs of objects of the hydrographic network
The following elements of the hydrographic network are depicted on the map - the coastal part of the seas, rivers, lakes, canals, streams, wells, ponds and other bodies of water.
Reservoirs are plotted on the map if their area on the image is more than $1 mm^2$. In another case, a body of water is applied only because of high importance, for example in dry areas. Objects are labeled with their name.
The characteristics of the objects of the hydrographic network are indicated next to the signature of the name of the object. In particular, they indicate in the form of a fraction the width (numerator), depth and nature of the soil (denominator), as well as the speed (in m / s) and direction of the current. Also indicated along with the characteristics of hydraulic structures - ferries, dams, locks. Rivers and canals are mapped in full. In this case, the type of display is determined by the width of the object and the scale of the map.
Remark 4
In particular, at a map scale of more than $1:50,000$, objects less than $5$ m wide, at a map scale of less than $1:100,000$ - less than $10$ m, are depicted by a $1$ line, and wider objects by two lines. Also, $2$ lines designate channels and ditches with a width of $3$ m or more, and with a smaller width - one line.
On large-scale maps, blue circles indicate wells, the letter “k” or “art.k” is placed next to it in the case of an artesian well. In dry areas, wells and water supply facilities are shown with enlarged signs. Water pipelines on the maps are shown by lines with blue dots: solid lines - ground, broken lines - underground.
Land cover signs
Often, when displaying land cover on a map, a combination of scale and off-scale symbols is used. Signs denoting forests, shrubs, gardens, swamps, meadows, nature are large-scale, and individual objects, for example, free-standing trees, are off-scale.
Example 3
The swampy meadow is displayed on the map as a combination of conventional symbols of a meadow, bushes and a swamp in a closed contour.
The contours of areas of terrain occupied by a forest, shrub or swamp are applied with a dotted line, except when the boundary is a fence, roads or other linear local object.
Forested areas are indicated in green with a symbol indicating the type of forest (coniferous, deciduous or mixed). Areas with forest growth or nurseries are plotted in pale green on the map.
Example 4
The image below shows a coniferous pine forest on the left with an average tree height of $25$ meters and a width of $0.3$ m, and a typical distance between tree trunks of $6$ m. The image on the right shows a deciduous maple forest with a tree height of $12$ m and a trunk width of $0.2$ m, the distance between which is $3$ meters on average.
Swamps are shown on the map with blue horizontal shading. At the same time, the type of hatching shows the degree of passability: intermittent hatching - passable, solid - difficult and impassable.
Remark 5
Swamps with a depth of less than $0.6$ m are considered passable.
Vertical shading in blue on the map indicates salt marshes. As well as for swamps, solid shading indicates impenetrable solonchaks, broken shading indicates passable ones.
Colors of symbols on topographic maps
The colors that depict objects on maps are universal for all scales. Black dashed marks - buildings, structures, local objects, strong points and boundaries, brown dashed marks - relief elements, blue - hydrographic network. Areal signs of light blue color - a mirror of waters of hydrographic network objects, green color - areas of tree and shrub vegetation, orange color - quarters with fire-resistant buildings and highways, yellow - quarters with non-fire-resistant buildings and improved dirt roads.
Remark 6
Special symbols are applied on military and special maps.
Any map has its own special language - special conventional signs. Geography studies all these designations, classifies them, and also develops new symbols to designate certain objects, phenomena and processes. It is useful for absolutely everyone to have a general idea of conventional cartographic signs. Such knowledge is not only interesting in itself, but will certainly be useful to you in real life.
This article is devoted to conventional signs in geography, which are used in the preparation of topographic, contour, thematic maps and large-scale terrain plans.
ABC cards
Just as our speech consists of letters, words and sentences, so any map includes a set of certain designations. With their help, topographers transfer this or that area onto paper. Conventional signs in geography are a system of special graphic symbols used to designate specific objects, their properties and characteristics. This is a kind of "language" of the map, created artificially.
It is rather difficult to say exactly when the very first geographical maps appeared. On all continents of the planet, archaeologists find ancient primitive drawings on stones, bones or wood, created by primitive people. So they depicted the area in which they had to live, hunt and defend themselves from enemies.
Modern conventional signs on geography maps display all the most important elements of the terrain: landforms, rivers and lakes, fields and forests, settlements, communication routes, country borders, etc. The larger the image scale, the more objects can be mapped . For example, on a detailed plan of the area, as a rule, all wells and sources of drinking water are marked. At the same time, marking such objects on a map of a region or country would be stupid and impractical.
A bit of history or how the symbols of geographical maps have changed
Geography is a science that is unusually closely related to history. Let's delve into it and we will find out how cartographic images looked many centuries ago.
Thus, the ancient medieval maps were characterized by the artistic rendering of the area with the widespread use of drawings as conventional signs. Geography at that time was just beginning to develop as a scientific discipline, therefore, when compiling cartographic images the scale and outlines (boundaries) of areal objects were often distorted.

On the other hand, all the drawings on the old drawings and portolans were individual and completely understandable. But nowadays you have to connect your memory in order to learn what these or other conventional signs on maps in geography mean.
Around the second half of the 18th century European cartography there has been a trend towards a gradual transition from individual perspective drawings to more specific plan symbols. In parallel, there was a need for a more accurate display of distances and areas on geographical maps Oh.
Geography: and topographic maps
Topographic maps and terrain plans are distinguished by rather large scales (from 1:100,000 or more). They are most often used in industry, agriculture, exploration, urban planning and tourism. Accordingly, the terrain on such maps should be displayed as detailed and detailed as possible.
For this, a special system of graphic symbols was developed. In geography, it is also often called the "map legend". For ease of reading and ease of remembering, many of these signs resemble the real appearance of the terrain objects depicted by them (from above or from the side). This system of cartographic symbols is standardized and mandatory for all enterprises that produce large-scale topographic maps.
The topic "Conventional signs" is studied in the school geography course in the 6th grade. To test the level of mastery of a given topic, students are often asked to write a short topographical story. Each of you probably wrote a similar “essay” at school. Offers with conventional signs for geography look something like the photo below:

All symbols in cartography are usually divided into four groups:
- large-scale (areal or contour);
- off-scale;
- linear;
- explanatory.
Let us consider in more detail each of these groups of signs.
Scale signs and their examples
In cartography, scale signs are those that are used to fill in any areal objects. It can be a field, a forest or an orchard. With the help of these conventional signs on the map, you can determine not only the type and location of a particular object, but also its actual size.
The boundaries of areal objects on topographic maps and terrain plans can be depicted as solid lines (black, blue, brown or pink), dotted or simple dotted lines. Examples of scale cartographic signs are shown below in the figure:

off-scale signs
If the object of the area cannot be depicted in the real scale of the plan or map, then in this case off-scale symbols are used. We are talking about too small, maybe, for example, a windmill, a sculptural monument, a rock-outlier, a spring or a well.
The exact location of such an object on the ground is determined by the main point symbol. For symmetrical signs, this point is located in the center of the figure, for signs with a wide base - in the middle of the base, and for signs that are based on a right angle - at the top of such an angle.
It is worth noting that the objects expressed on the maps by non-scale conventional signs serve as excellent landmarks on the ground. Examples of off-scale cartographic signs are shown in the figure below:
Linear signs
Sometimes the so-called linear cartographic signs are also distinguished into a separate group. It is easy to guess that with their help linearly extended objects are designated on plans and maps - roads, boundaries of administrative units, railways, fords, etc. Interesting feature linear symbols: their length always corresponds to the scale of the map, but the width is significantly exaggerated.
Examples of linear cartographic symbols are shown in the figure below.
Explanatory signs
Perhaps the most informative is the group of explanatory conventional signs. With their help, additional characteristics of the depicted terrain objects are indicated. For example, a blue arrow in the riverbed indicates the direction of its flow, and the number of transverse strokes on the designation of the railway corresponds to the number of tracks.
On maps and plans, as a rule, the names of cities, towns, villages, mountain peaks, rivers and other geographical objects are signed. Explanatory symbols can be numeric or alphabetic. Letter designations are most often given in an abbreviated form (for example, a ferry crossing is indicated as an abbreviation "par.").
Symbols for contour and thematic maps
A contour map is a special kind of geographical maps intended for educational purposes. It contains only a coordinate grid and some elements of the geographical basis.
The set of conventional symbols for contour maps in geography is not very wide. The very name of these maps is quite eloquent: for their compilation, only contour designations of the boundaries of certain objects - countries, regions and regions - are used. Sometimes rivers are also applied to them and big cities(in the form of dots). By and large, contour map- this is a "silent" map, which is just designed to fill its surface with certain conventional signs.
Thematic maps are most often found in atlases of geography. The symbols of such cards are extremely diverse. They can be depicted as a color background, areas or so-called isolines. Diagrams and cartograms are often used. In general, each type of thematic map has its own set of specific symbols.
Scale, or contour, conditional topographic signs are used to depict local objects that, by their size, can be expressed on a map scale, that is, their dimensions (length, width, area) can be measured on a map. For example: a lake, a meadow, large gardens, quarters of settlements. The contours (outer boundaries) of such local objects are depicted on the map with solid lines or dotted lines, forming figures similar to these local objects, but only in a reduced form, that is, on a map scale. Solid lines show the contours of quarters, lakes, wide rivers, and the contours of forests, meadows, swamps - dotted lines.
Figure 31.
Structures and buildings, expressed on the scale of the map, are depicted by figures similar to their actual outlines on the ground and are painted over in black. Figure 31 shows several scale (a) and off-scale (b) symbols.
Off-scale symbols
Explanatory topographic signs serve to additionally characterize local objects and are used in combination with large-scale and off-scale signs. For example, a figurine of a coniferous or deciduous tree inside the outline of a forest shows the dominant tree species in it, an arrow on a river indicates the direction of its flow, etc.
In addition to signs, full and abbreviated signatures are used on the maps, as well as digital characteristics of some objects. For example, the signature "mash." with the sign of the plant means that this plant is a machine-building plant. The names of settlements, rivers, mountains, etc. are fully signed.
Numerical designations are used to indicate the number of houses in rural settlements, the height of the area above sea level, the width of the road, the characteristics of the carrying capacity and the size of the bridge, as well as the size of the trees in the forest, etc. Numerical designations related to conventional relief signs are printed in brown , width and depth of rivers in blue, everything else in black.
Let us briefly consider the main types of topographic symbols for depicting the area on the map.
Let's start with terrain. Due to the fact that observation conditions, terrain passability and its protective properties largely depend on its nature, the terrain and its elements are depicted on all topographic maps in great detail. Otherwise, we could not use the map to study and evaluate the area.
In order to clearly and fully imagine the area on the map, you must first of all be able to quickly and correctly determine on the map:
Types of irregularities of the earth's surface and their relative position;
Mutual excess and absolute heights of any points of the terrain;
The shape, steepness and length of the slopes.
On modern topographic maps, the relief is depicted by contour lines, that is, curved closed lines, the points of which are located on the ground at the same height above sea level. In order to better understand the essence of the depiction of the relief by contour lines, let us imagine an island in the form of a mountain, gradually flooded with water. Let us assume that the water level successively stops at regular intervals equal in height to h meters (Fig. 32).
Then each water level will have its own coastline in the form of a closed curved line, all points of which have the same height. These lines can also be considered as traces of a section of terrain irregularities by planes parallel to the level surface of the sea, from which heights are counted. Based on this, the distance h in height between the secant surfaces is called the height of the section.

Figure 32.
So, if all lines of equal heights are projected onto the level surface of the sea and depicted on a scale, then we will get an image of a mountain on a map in the form of a system of curved closed lines. These will be horizontal.
In order to find out whether it is a mountain or a basin, there are slope indicators - small dashes that are applied perpendicular to the horizontal lines in the direction of lowering the slope.

Figure 33.
The main (typical) landforms are shown in Figure 32.
The height of the section depends on the scale of the map and on the nature of the relief. The normal height of the section is considered to be a height equal to 0.02 of the map scale value, that is, 5 m for a map of a scale of 1:25 OOO and, respectively, 10, 20 m for maps of scales 1: 50,000, 1: 100,000. above the height of the section, are drawn by solid lines and are called main or solid contour lines. But it happens that at a given height of the section, important details of the relief are not expressed on the map, since they are located between the cutting planes.
Then half semi-horizontals are used, which are drawn through half the main height of the section and plotted on the map dashed lines. To determine the count of contour lines when determining the height of points on the map, all solid contour lines corresponding to five times the height of the section are drawn thickened (thickened contour lines). So, for a map with a scale of 1: 25,000, each horizontal line corresponding to the height of the section 25, 50, 75, 100, etc. will be drawn as a thickened line on the map. The main height of the section is always indicated under the south side of the map frame.
The heights of the hills on the ground depicted on our maps are counted from the level of the Baltic Sea. The heights of points on the earth's surface above sea level are called absolute, and the excess of one point above another is called relative excess. Horizontal marks - digital inscriptions on them - indicate the height of these terrain points above sea level. The top of these numbers is always facing upward slope.

Figure 34.
Marks of command heights, from which the terrain from the most important objects on the map (large settlements, road junctions, passes, mountain passes, etc.) is better viewed than others, are applied in large numbers.
With the help of contour lines, you can determine the steepness of the slopes. If you look closely at Figure 33, you can see from it that the distance between two adjacent contours on the map, called the laying (with a constant section height), changes depending on the steepness of the slope. The steeper the slope, the smaller the laying and, conversely, the more flat the slope, the greater the laying. Hence the conclusion follows: steep slopes on the map will differ in the density (frequency) of contour lines, and in flat places the contour lines will be less frequent.
Usually, to determine the steepness of the slopes, a drawing is placed on the margins of the map - laying scale(Fig. 35). Along the lower base of this scale are numbers that indicate the steepness of the slopes in degrees. On the perpendiculars to the base, the corresponding values of the deposits are plotted on the scale of the map. On the left side, the scale of embeddings is built for the main height of the section, on the right - at five times the height of the section. To determine the steepness of the slope, for example, between points a-b(Fig. 35), you need to take this distance with a compass and set aside on the scale and read the steepness of the slope - 3.5 °. If it is required to determine the steepness of the slope between the horizontals thickened n-t, then this distance should be set aside on the right scale and the steepness of the slope in this case will be equal to 10 °.

Figure 35.
Knowing the property of contour lines, it is possible to determine from the map and the shape various kinds stingrays (Fig. 34). In an even slope, the inceptions will be approximately the same throughout its entire length, in a concave one they increase from the top to the sole, and in a convex one, on the contrary, the inceptions decrease towards the sole. In wavy slopes, the laying changes according to the alternation of the first three forms.
When depicting relief on maps, not all of its elements can be expressed as contour lines. So, for example, slopes with a steepness of more than 40 ° cannot be expressed as horizontals, since the distance between them will be so small that they will all merge. Therefore, slopes with a steepness of more than 40 ° and steep are indicated by horizontal lines with dashes (Fig. 36). Moreover, natural cliffs, ravines, gullies are indicated in brown, and artificial embankments, excavations, mounds and pits are indicated in black.

Figure 36.
Consider the main conditional topographic signs for local objects. Settlements are depicted on the map with the preservation of external borders and planning (Fig. 37). All streets, squares, gardens, rivers and canals, industrial enterprises, outstanding buildings and structures that have the value of landmarks are shown. For better visibility, fire-resistant buildings (stone, concrete, brick) are painted over in orange, and blocks with non-fire-resistant buildings are painted in yellow. The names of settlements on the maps are signed strictly from west to east. The type of administrative value of a settlement is determined by the type and size of the font (Fig. 37). Under the signature of the name of the settlements, you can find a number indicating the number of houses in it, and if there is a district or village council in the settlement, the letters “RS” and “SS” are additionally put.

Figure 37-1.

Figure 37-2.
No matter how poor the area is in local objects or, on the contrary, saturated, there are always separate objects on it, which stand out from the rest in size and are easily recognized on the ground. Many of them can be used as landmarks. This should include: factory chimneys and outstanding buildings, tower-type buildings, wind turbines, monuments, auto columns, signs, kilometer posts, stand-alone trees, etc. (Fig. 37). Most of them, but due to their size, cannot be shown on the scale of the map, so they are depicted on it with off-scale signs.
The road network and crossings (Fig. 38, 1) are also depicted by off-scale conventional signs. Data on the width of the carriageway, road surface, indicated on the conventional signs, make it possible to evaluate their throughput, carrying capacity, etc. Railways, depending on the number of tracks, are indicated by dashes across the conventional road sign: three dashes - a three-track railway, two dashes - a double-track railway . Stations, embankments, cuts, bridges and other structures are shown on railways. At bridges longer than 10 m, its characteristic is signed.

Figure 38-1.

Figure 38-2.

Figure 39.
For example, the signature at the bridge ~ means that the length of the bridge is 25 m, the width is 6 m, and the load capacity is 5 tons.
Hydrography and structures associated with it (Fig. 38, 2), depending on the scale, are shown with greater or lesser detail. The width and depth of the river is signed as a fraction 120/4.8, which means:
The width of the river is 120 m and its depth is 4.8 m. The speed of the river flow is shown in the middle of the symbol with an arrow and a number (the number indicates the speed of 0.1 meters per second, and the arrow indicates the direction of the flow). On rivers and lakes, the height of the water level in the low water period (mark of the water's edge) in relation to sea level is also signed. At the fords, it is signed: in the numerator - the depth of the ford in meters, and in the denominator - the quality of the soil (T - hard, P - sandy, B - viscous, K - rocky). For example, br. 1.2/k means that the ford is 1.2 m deep and the bottom is rocky.
The soil and vegetation cover (Fig. 39) is usually depicted on maps with large-scale symbols. These include forests, shrubs, gardens, parks, meadows, marshes, salt marshes, as well as sands, rocky surfaces, and pebbles. In the forests, its characteristics are indicated. For example, a mixed forest (spruce with birch) has the numbers 20 / \ 0.25 - this means that the average height of trees in the forest is 20 m, their average thickness is 0.25 m, the average distance between tree trunks is 5 meters.

Figure 40.
Swamps are depicted depending on their passability on the map: passable, difficult to pass, impassable (Fig. 40). Passable swamps have a depth (to solid ground) of no more than 0.3-0.4 m, which is not shown on the maps. The depth of difficult and impenetrable swamps is signed next to the vertical arrow indicating the location of the sounding. On the maps, the cover of swamps (grass, moss, reed), as well as the presence of forests and shrubs on them, are shown with the corresponding conventional signs.
Hilly sands differ from flat sands and are indicated on the map by a special symbol. In the southern steppe and semi-steppe regions, there are areas of terrain with soil abundantly saturated with salt, which are called solonchaks. They are wet and dry, some are impassable, while others are passable. On the maps, they are indicated by conventional signs - “shading” in blue. The image of solonchaks, sands, swamps, soil and vegetation cover is shown in Figure 40.
Off-Scale Conventional Signs of Local Items
Answer: Off-scale symbols are used to depict small local objects that are not expressed on the scale of the map - detached trees, houses, wells, monuments, etc. If they were depicted on the scale of the map, they would turn out to be in the form of a point. Examples of depicting local objects with off-scale conventional signs are shown in Figure 31. The exact location of these objects depicted with off-scale conventional signs (b) is determined by the center of the symmetrical figure (7, 8, 9, 14, 15), in the middle of the base of the figure (10, 11) , at the top of the corner of the figure (12, 13). Such a point on the figure of an off-scale symbol is called the main point. In this figure, the arrow shows the main points of the conventional signs on the map.
This information is useful to remember in order to correctly measure the distance between local objects on the map.
(This issue is discussed in detail in question No. 23)
Explanatory and conventional signs of local objects
Answer: Types of topographic symbols
The area on maps and plans is depicted by topographic symbols. All conventional signs of local objects according to their properties and purpose can be divided into the following three groups: contour, scale, explanatory.